LMS Reporting: Metrics That Actually Matter
A measurement guide to LMS reporting: separate decision-driving metrics from vanity numbers, pair completion with learning evidence, and keep data comparable.
By DoviLearn® Insights Team
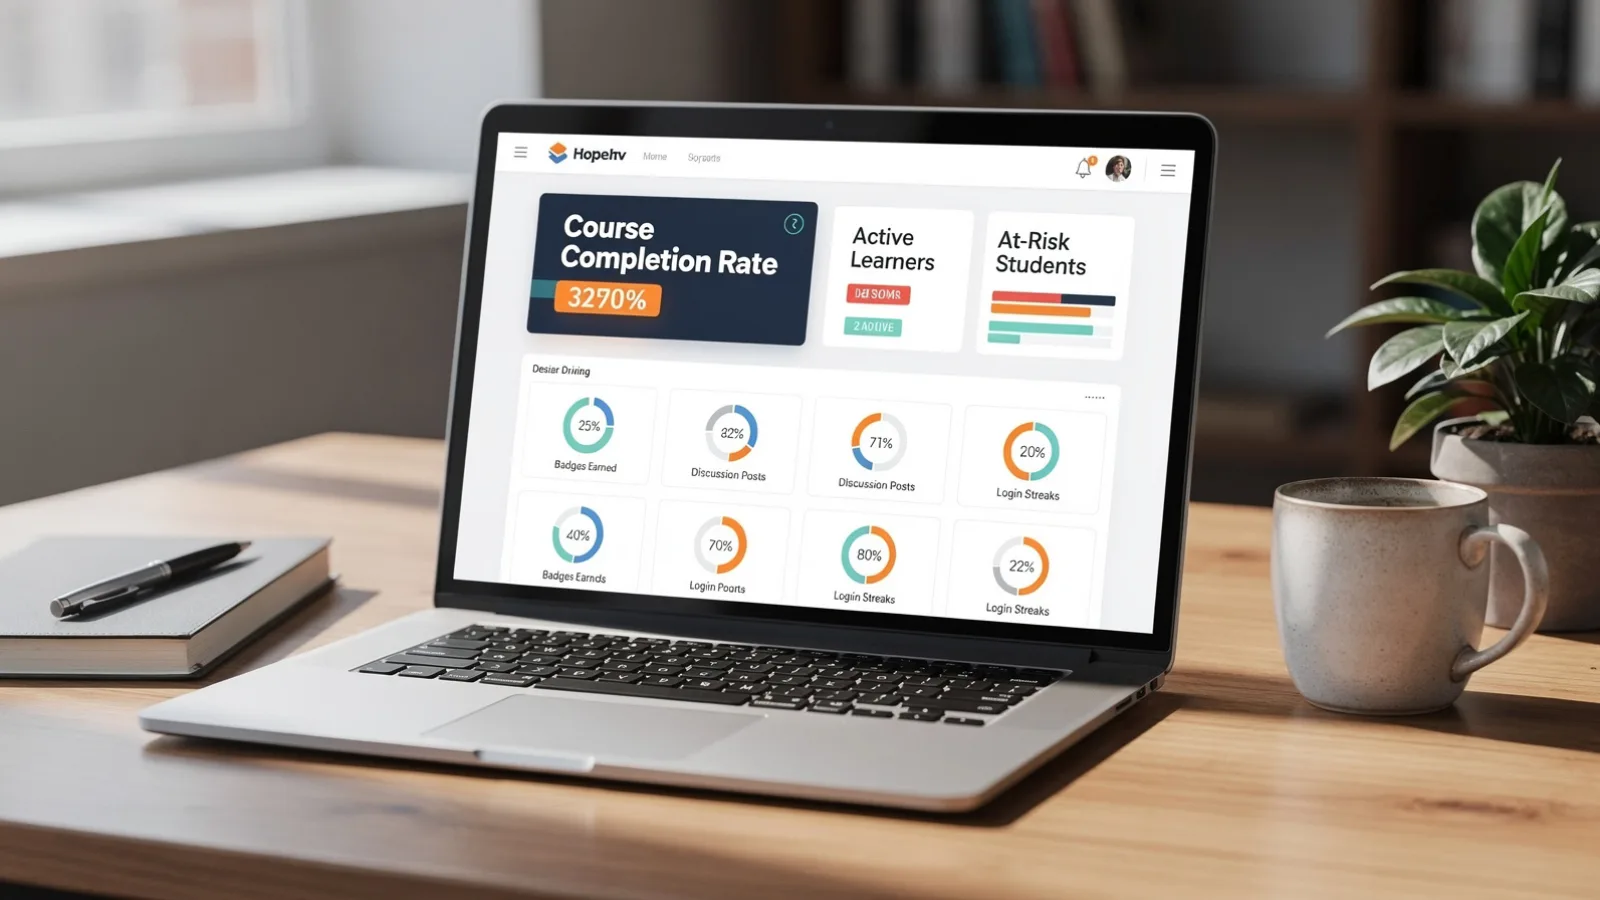
Most LMS dashboards are generous with numbers and stingy with meaning. Logins, page views and completion rates are easy to count and easy to misread. A metric earns its place on a report only if someone would act differently depending on its value. This guide is about choosing LMS reporting metrics that actually matter, and treating a misleading metric like a misconception: a stable wrong belief about what the data says. It is not about governing roles and permissions, which is covered separately.
Completion is not comprehension
A completion rate tells you a learner reached the end, not that they understood or can apply anything. Treating it as a learning outcome is a reporting misconception, and it quietly sets the wrong incentives. The What Works Clearinghouse publishes standards and procedures for judging the strength of education evidence. [c-wwc] Holding your own reports to a similar standard means asking what each metric would let you conclude, and what it would not.
Diagnose your metrics before you trust them
• Observe which metrics leaders actually look at, and which ones change a decision versus which ones only decorate a slide.
• Probe each metric: ask what two different values would make you do differently, and discard any metric with the same answer either way.
• Correct by pairing activity with evidence of learning, so a high completion rate is read next to a check of what was learned.
• Reassess the report itself on a cycle, retiring metrics that never drove an action.
Editorial illustration representing the article subject. ⚠ AI-generated editorial illustration. It represents the article’s subject and does not document a real event or identify real people.
Close
AI-generated editorial illustration. It represents the article’s subject and does not document a real event or identify real people.
Make the data comparable across tools
Reporting falls apart when every tool counts things differently. You need activity defined the same way wherever it happens. The Experience API records learning activity as structured statements so that behaviour can be analysed across systems. [c-xapi] A shared statement format is what lets a metric mean the same thing across an LMS and the tools plugged into it.
Where DoviLearn® fits
An institutional reporting setup described under DoviLearn® for organisations can be tested with this workflow: ask which metrics drive decisions, how activity is paired with evidence of learning, and how definitions stay consistent across the DoviLearn® platform and technology . The standards and the judgement stay with educators and organisations, and the example shows a process rather than guaranteed learning, employment or business outcomes.
Related reading
• Related: how AI tutors can surface misconceptions .
• Related: how to govern LMS roles and permissions .
• Related: mastering the digital classroom .
References
• What Works Clearinghouse: Handbooks and resources , U.S. Department of Education, Institute of Education Sciences. WWC standards handbook and procedures
• Experience API (xAPI) specification , Advanced Distributed Learning Initiative. Experience API data specification